Meteorological & Visual Integration for Turbulence Strength
Accurate Turbulence Strength Without Expensive Equipment
A new approach to long-range image understanding under
atmospheric turbulence.
WACV 2025 Paper ID #724
Authors: Ripon Kumar Saha (ASU), Scott McCloskey (Kitware), Suren Jayasuriya (ASU)
Atmospheric turbulence introduces blur and geometric distortion in long-range images
by bending light rays through varying refractive indices. Its severity is expressed
by the refractive index structure parameter
Cn2. Traditional ways to measure
Cn2 need complex and expensive optical gear, limiting
broad adoption.
Our solution: MetaVIn is a Meteorological and Visual Integration system
that combines image sharpness metrics with weather station data
in a Kolmogorov Arnold Network (KAN). This enables accessible and accurate turbulence strength
estimation, vital for improving remote sensing, UAV surveillance, astrophotography,
and more.
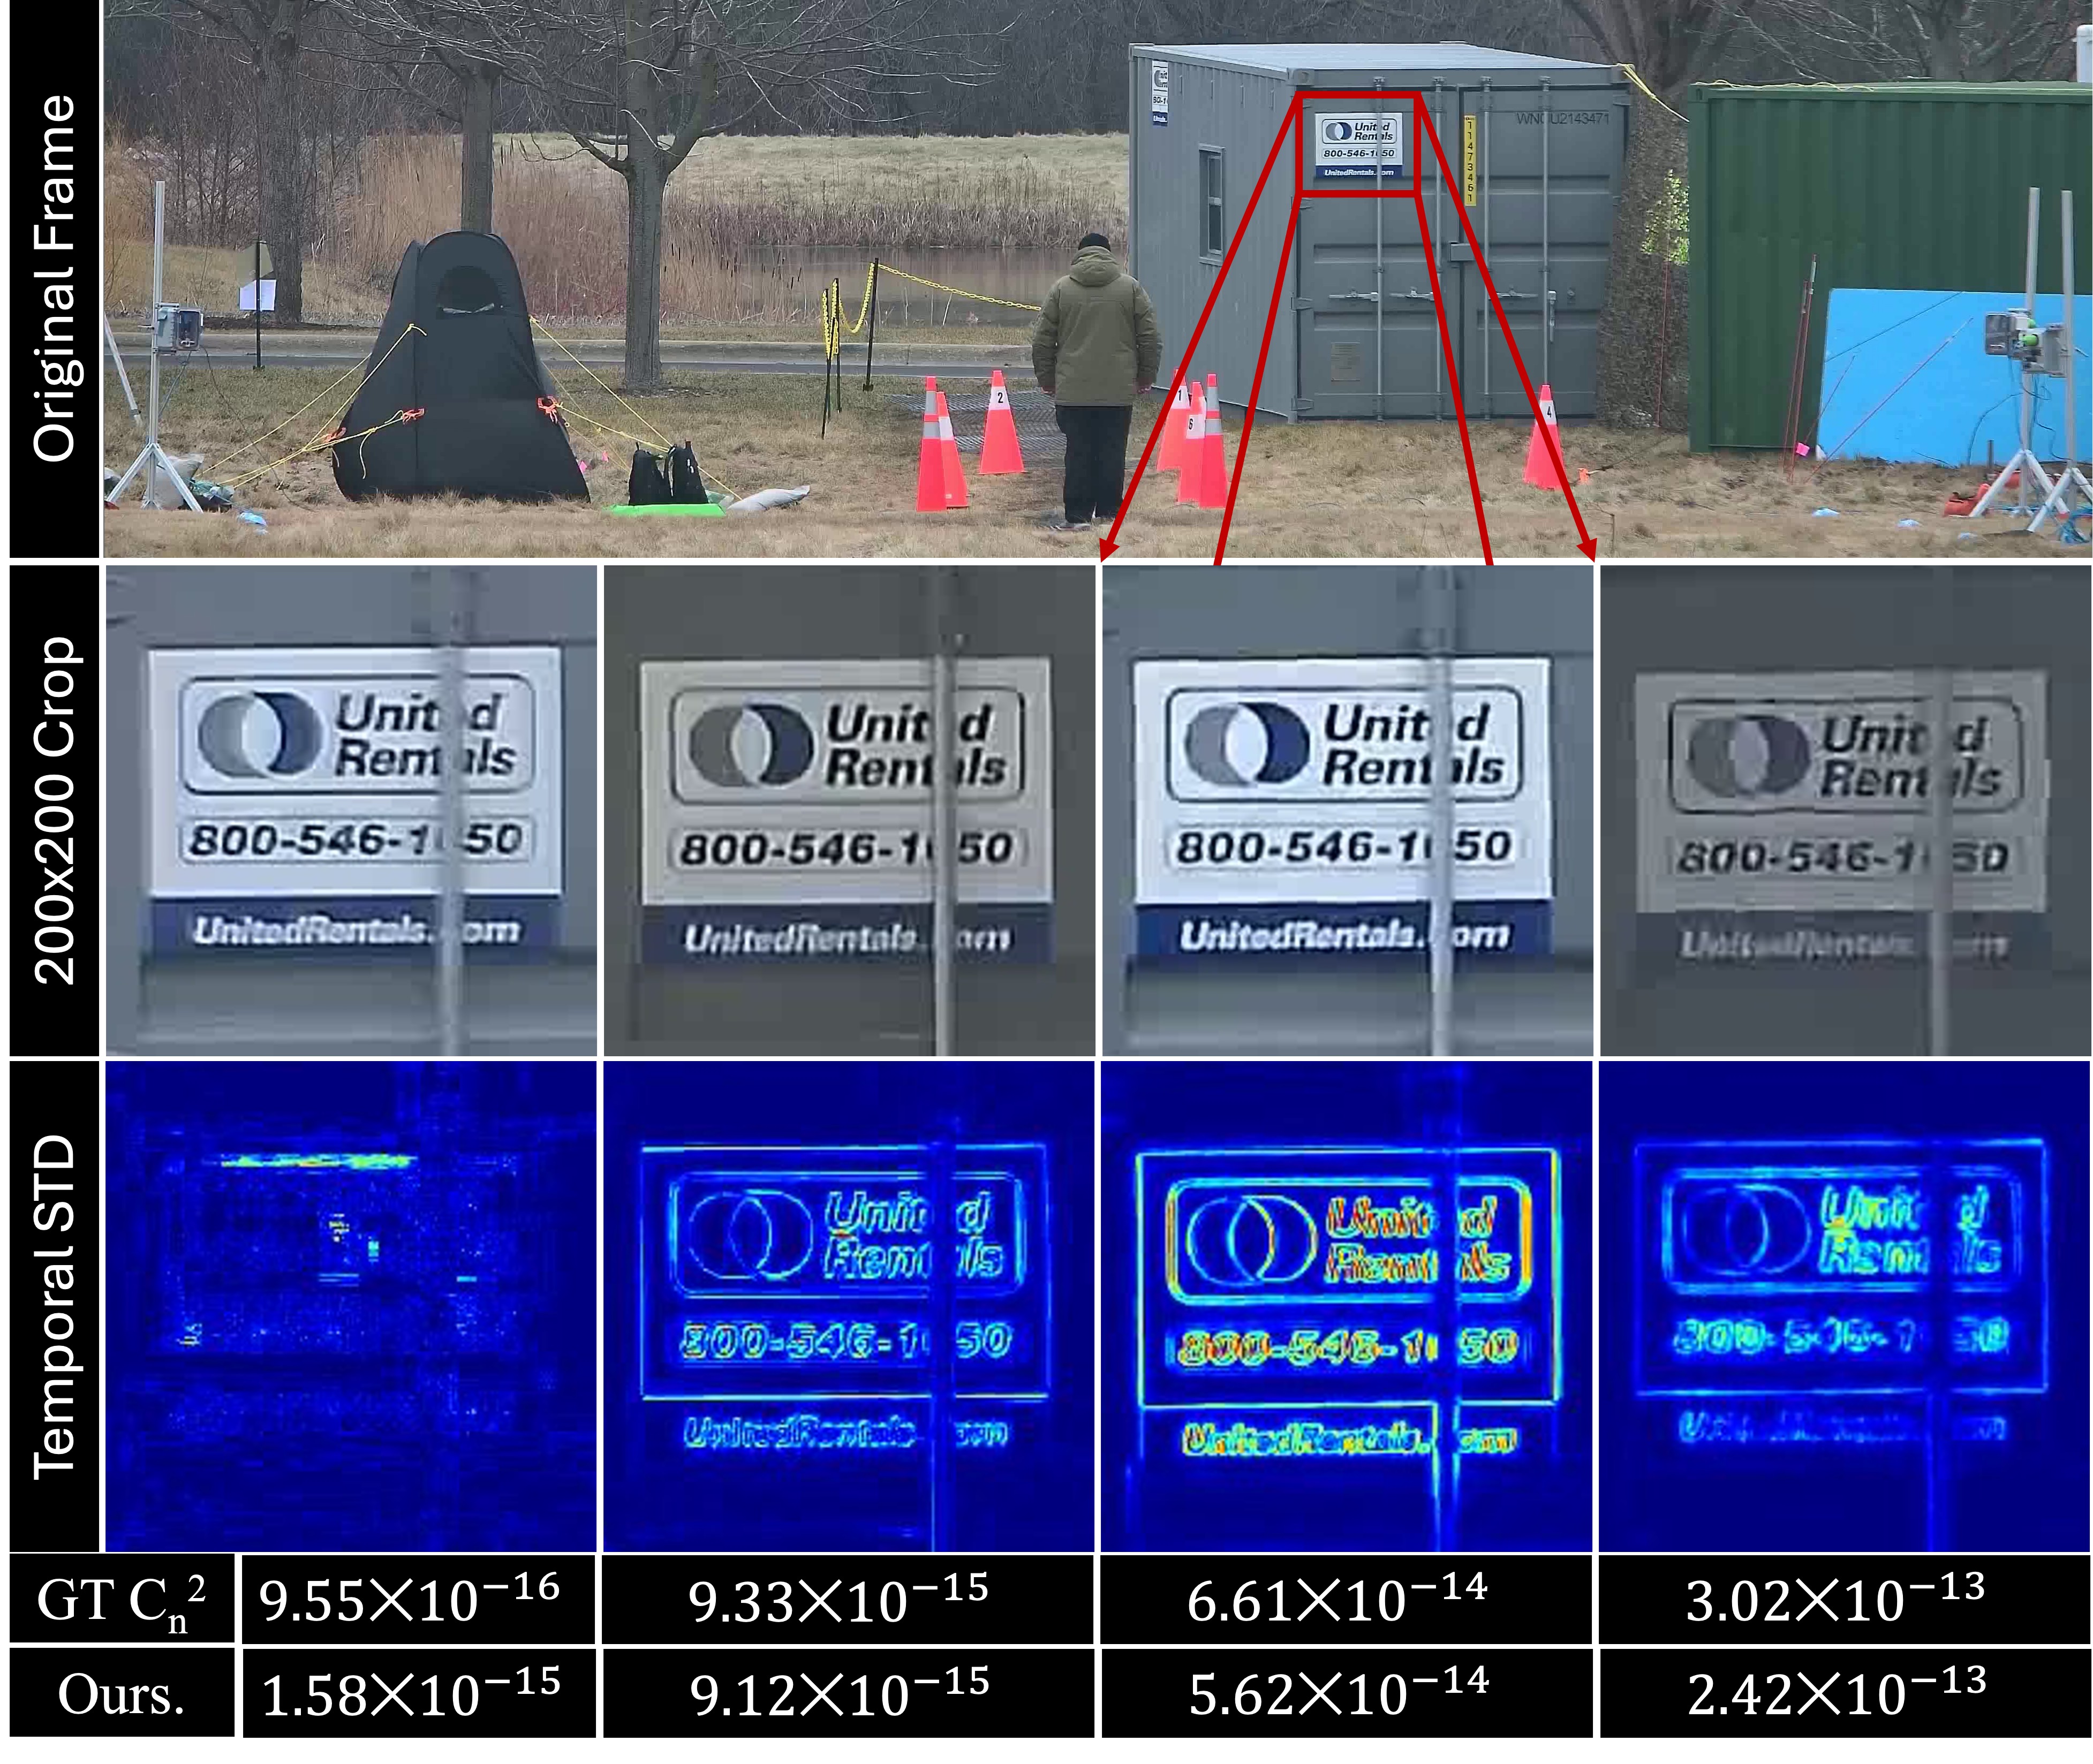
Single frames with varying turbulence intensities. MetaVIn accurately infers
Cn2 by fusing meteorological and visual features.
The Challenge
For computer vision tasks analyzing distant objects, atmospheric turbulence
often degrades images with random blur, distortions, and jitters. These effects
worsen with:
Large propagation distances
Extremes in temperature, humidity, or wind
Vibrations from camera motion
Changing sunlight or solar loading
Estimating Cn2 helps quantify this degradation.
But existing methods often use:
Scintillometers or wavefront sensors (too expensive & bulky)
Video-based approaches that fail in real-world conditions with motion
Meteorological data alone that can’t capture path-averaged turbulence
Generic blind IQA metrics poorly correlated to actual turbulence
We offer a simpler method using simple sharpness measures from
a single frame, combined with affordable weather station data.
Our Approach
Visual & Meteorological Fusion
MetaVIn extracts sharpness metrics (sum of Laplacian, Tenengrad,
variance of gradients) from a single video frame to gauge blur. Simultaneously,
it gathers meteorological data (temperature, wind, pressure, humidity, solar loading)
plus a single distance measurement from a laser rangefinder to the scene.
Kolmogorov Arnold Network (KAN)
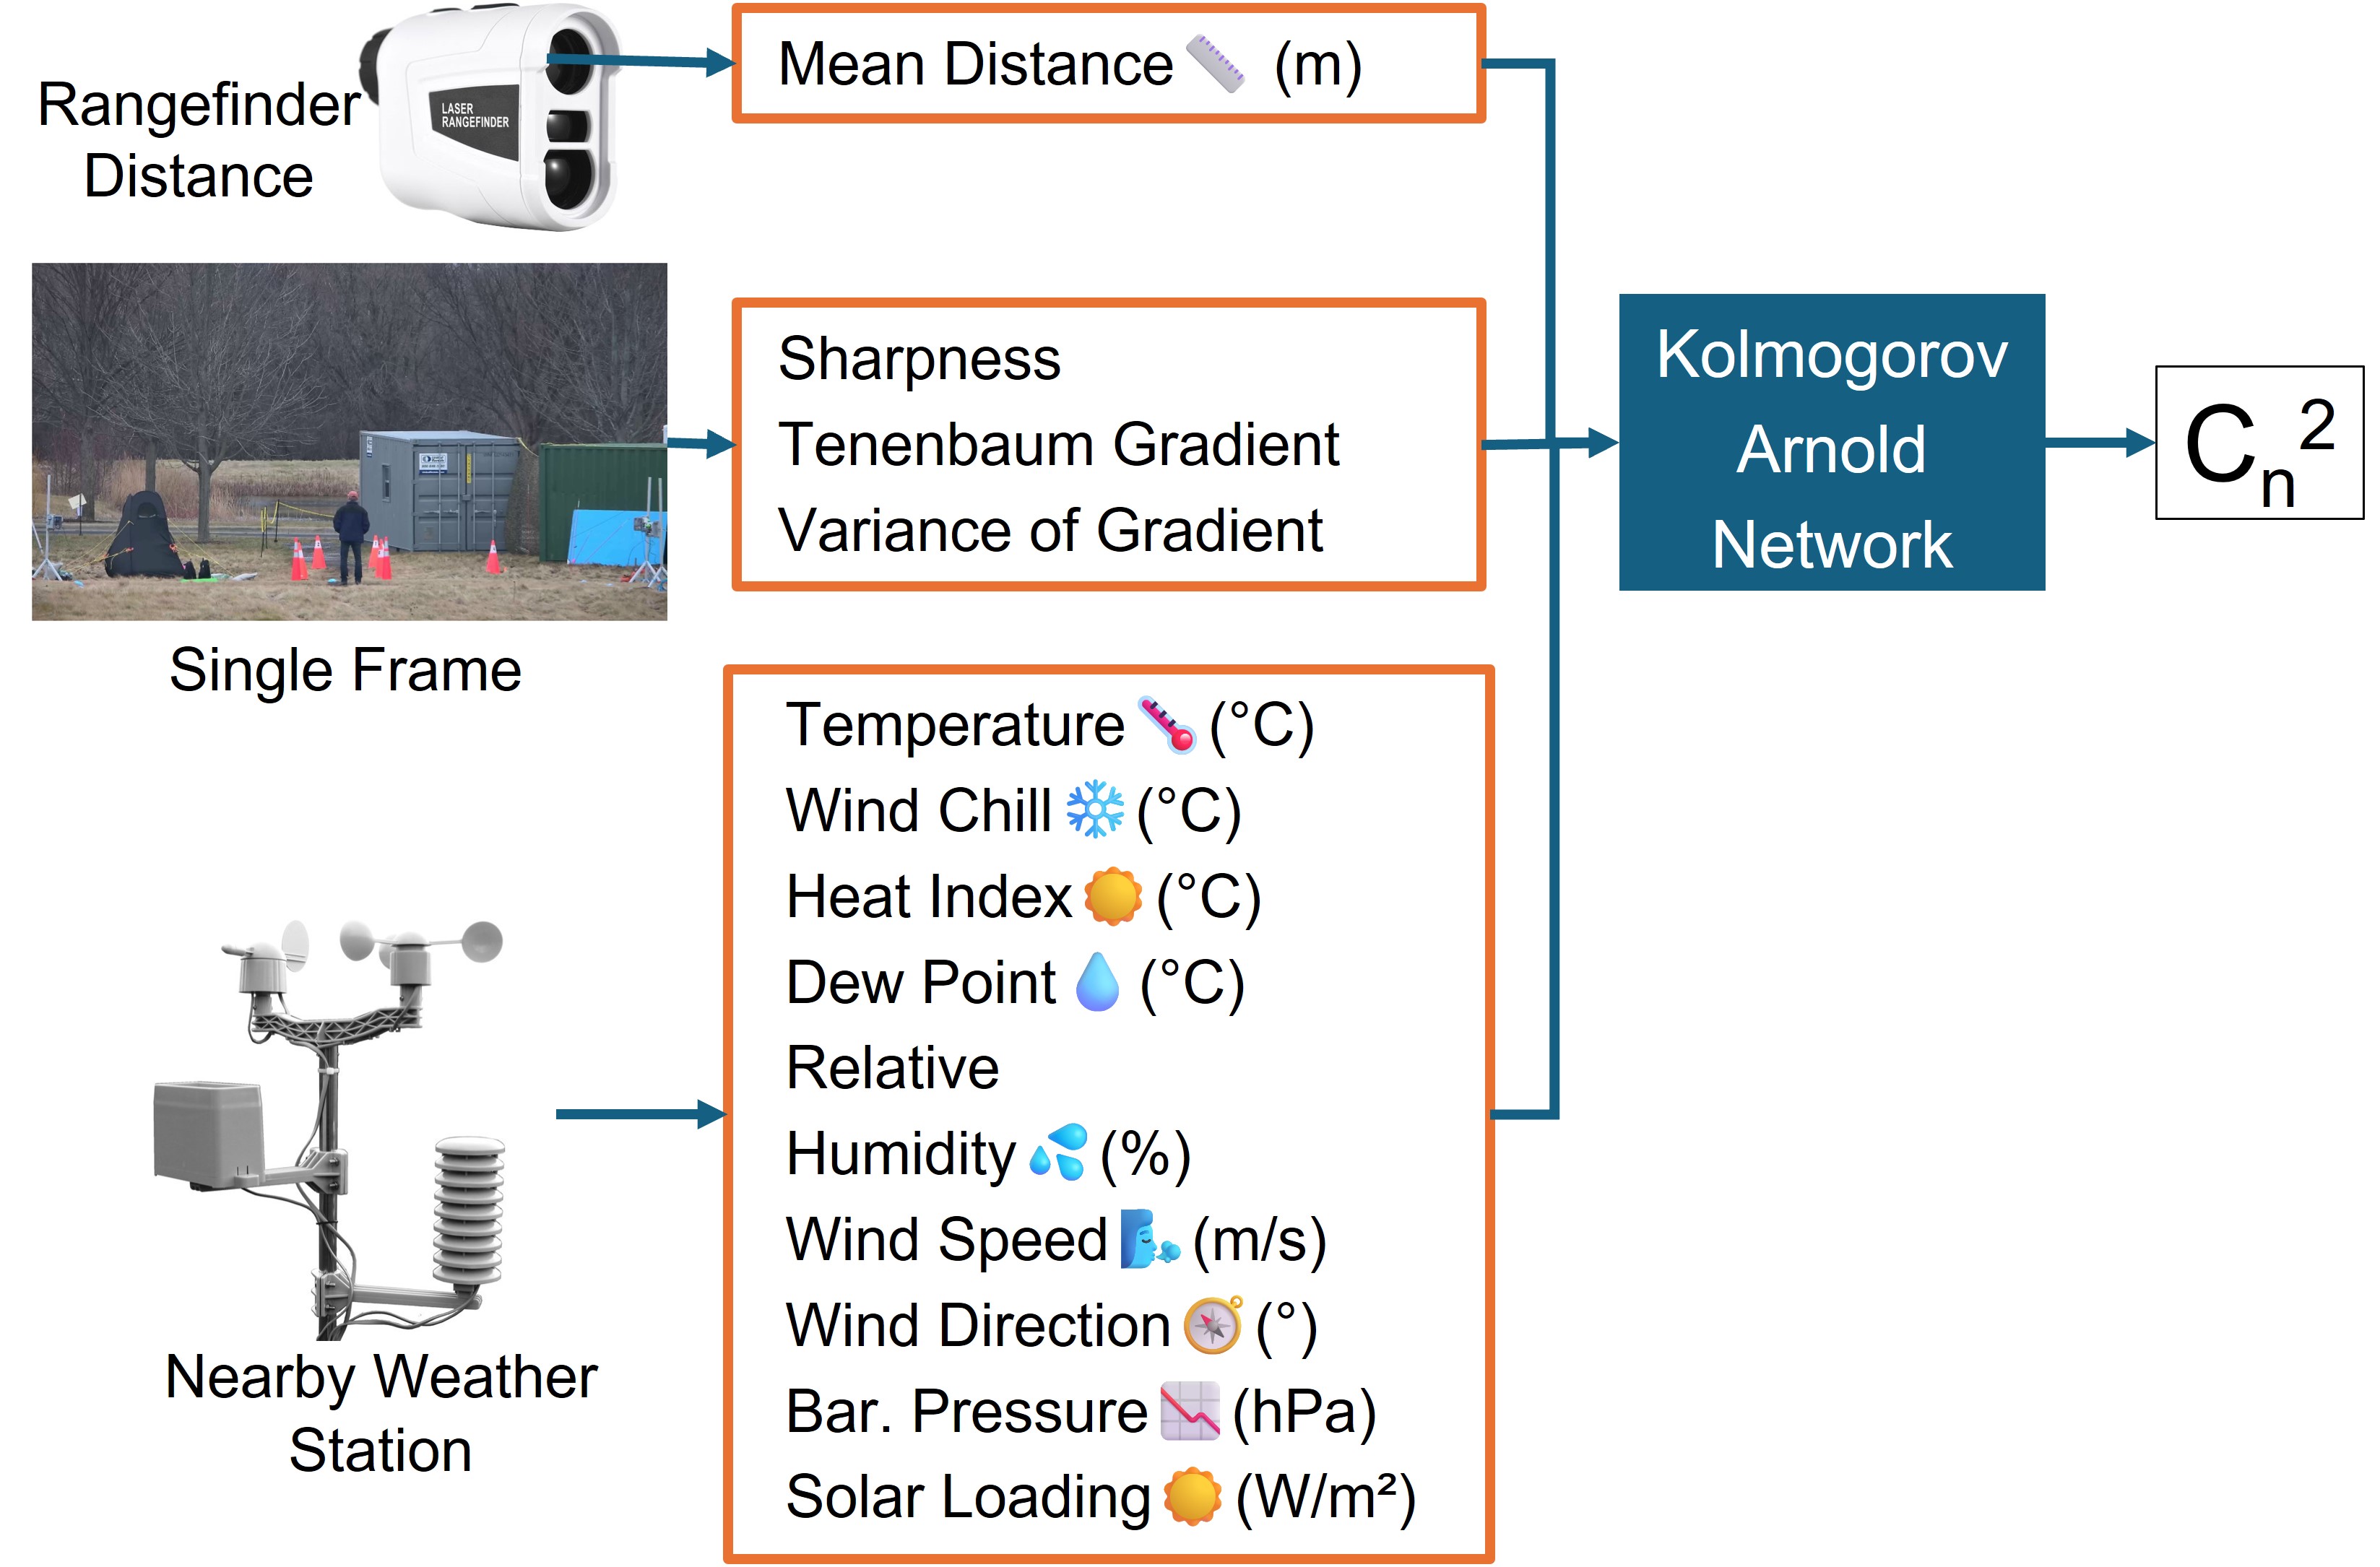
KAN architecture fusing meteorological signals, image sharpness, and distance to predict Cn2.
We feed these inputs (3 image features, 9 weather metrics, plus distance) into a
Kolmogorov Arnold Network. This specialized architecture uses learnable univariate
activation functions to capture non-linear relationships between environment,
image quality, and turbulence strength.
With just a few hidden units and a high learning rate, the KAN efficiently predicts
the log-scaled Cn2. This avoids the need for huge
training sets or complex computing hardware.
Dataset & Setup
We test on a large dataset of 35,364 samples across multiple geographic sites.
Each sample has ground-truth Cn2 from a
large-aperture scintillometer, plus weather station readings (temperature, wind
speed, humidity, solar loading, etc.) and single-frame images from multiple
videos. A cost-effective laser rangefinder provides distance to the scene.
If you would like to use the dataset titled
“Expanding accurate person recognition to new altitudes and ranges:
The briar dataset” by David Cornett, please contact the first author.
Dataset
Location
Date
Samples (BRS/BTS)
BRS1.1
ORNL, TN
Nov 2021
1663 / —
BRS2
Perry, GA
Mar–Apr 2022
9083 / —
BRS3 / BTS3
ORNL, TN
Aug–Sep 2022
8498 / 4305
BRS4 / BTS4
Glen Ellyn, IL
Jan 2023
7751 / 4064
We train on some splits (BRS datasets) and test on others (BTS datasets),
ensuring robust evaluation across diverse weather conditions (temperatures
from -5.3°C to 32.8°C, wind up to 19 m/s, solar loading up to 1223 W/m²).
We also perform data imputation to fill occasional gaps in sensor readings.
Key Results
MetaVIn significantly outperforms standard blind IQA metrics and purely image-based
deep learning approaches. Our method achieves:
Spearman correlation: 0.943 (best overall)
Low mean absolute error (MAE) on log-scale Cn2
Robustness to vibration, moving objects, and real-world weather
By leveraging synergy between atmospheric conditions and image clarity, we see
better predictions than relying on any single modality. Below is a quick comparison
table summarizing performance:
Method
Spearman ↑
MAE ↓
Rel. Error ↓
Classical IQA (BRISQUE, NIQE, etc.)
≤ 0.14
≥ 0.78
≥ 0.057
Gradient-based Passive
0.079
0.631
0.079
Deep CNN (EfficientNetV2)
0.762
0.354
0.025
MetaVIn (This Work)
0.943
0.177
0.006
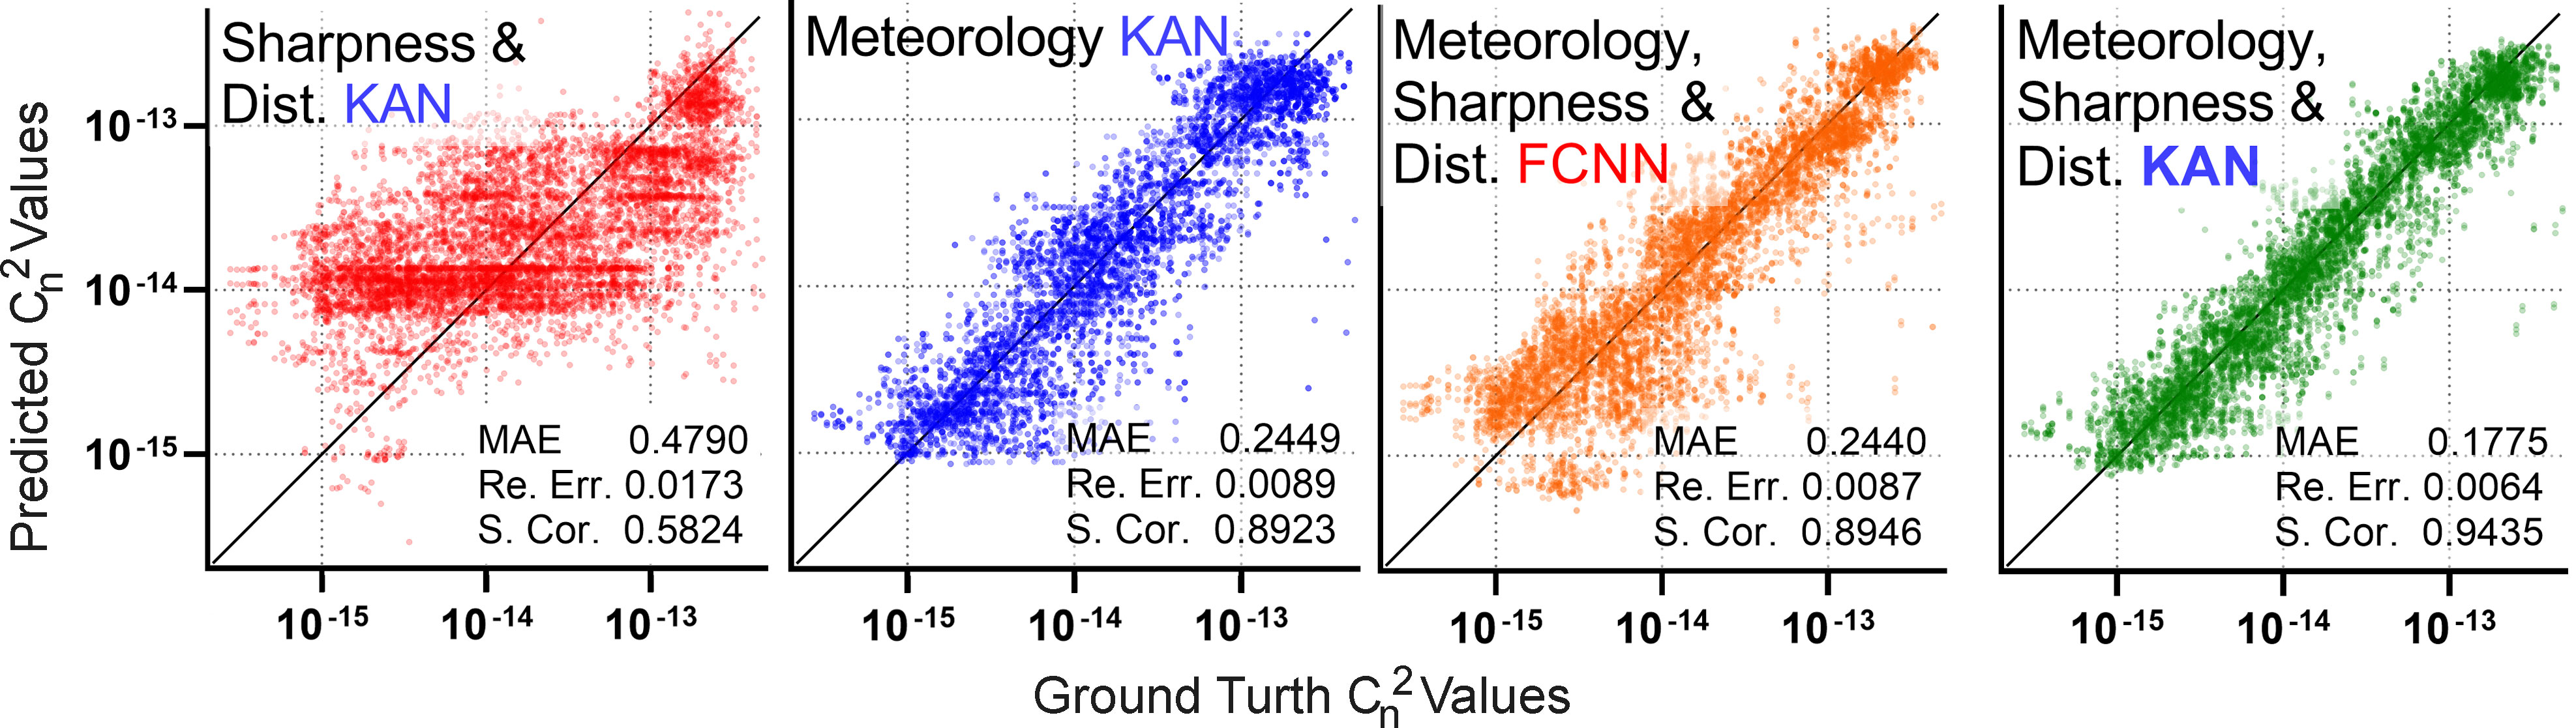
Comparisons of predicted vs. ground-truth Cn2 across setups.
MetaVIn’s results align closely with true values across broad conditions.
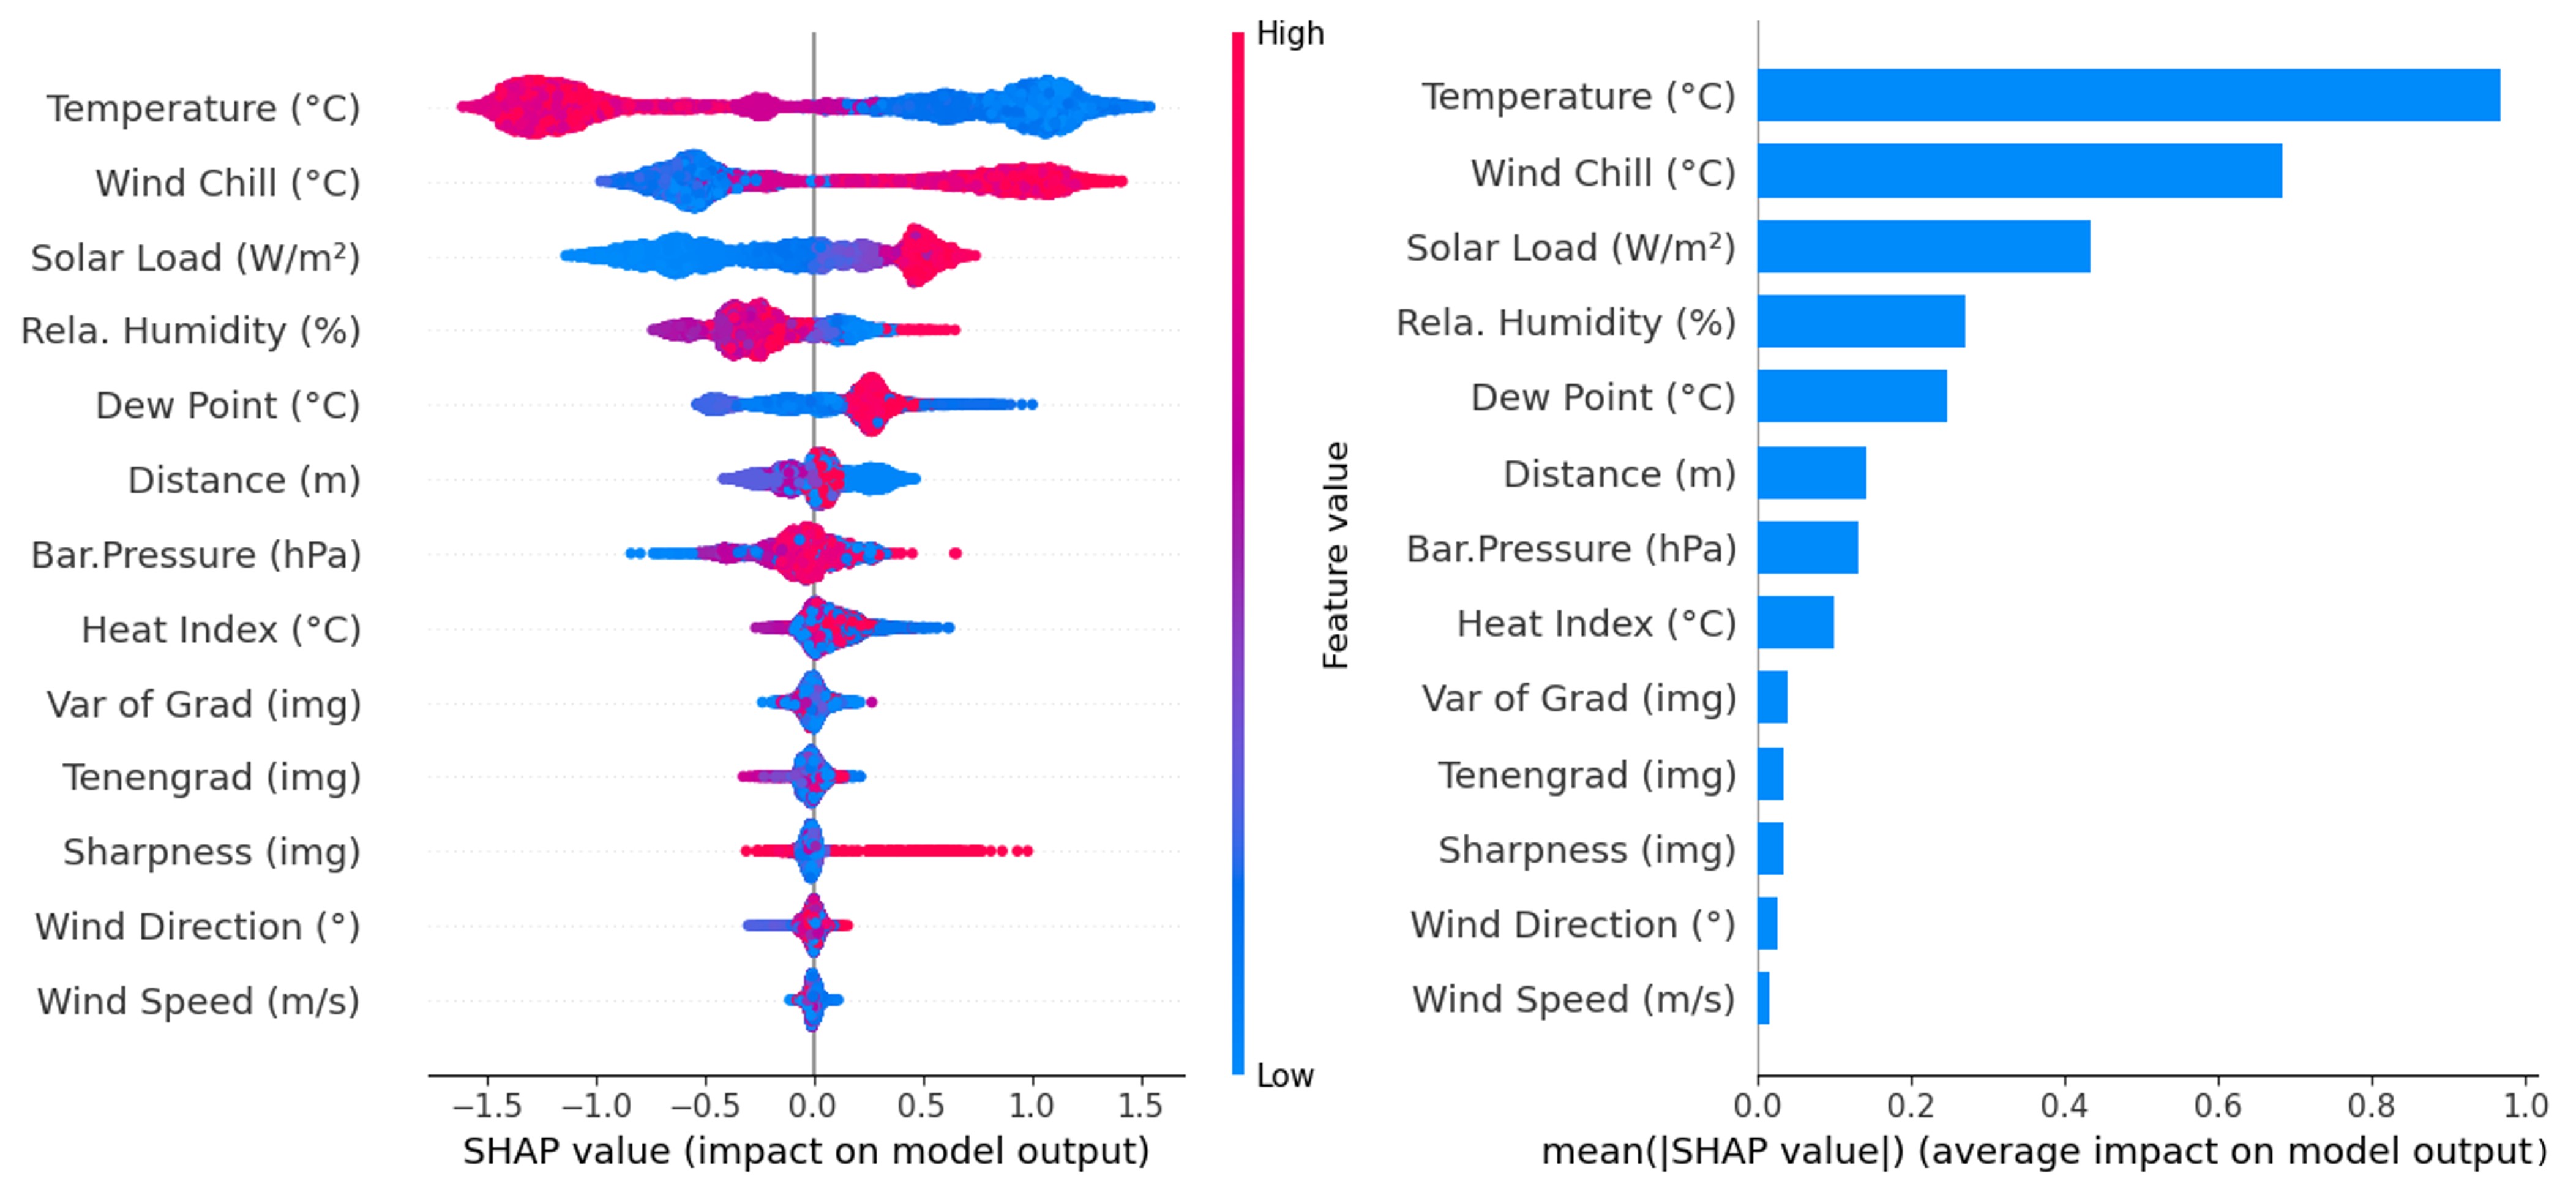
Feature importance analysis underscores synergy between weather metrics + image
sharpness + distance for robust turbulence estimation.
Project Demo Video
Watch a short walkthrough of our approach, including how MetaVIn fuses meteorological
data and image features:
Contact & Future Plans
For details on using or extending MetaVIn, or for collaborations, please get in
touch with us.
Limitations: MetaVIn currently uses only single-frame metrics
(no full spatiotemporal analysis). We also rely on co-located weather stations
and a single laser rangefinder measurement.
Future Work: We plan to integrate spatiotemporal features for
continuous Cn2 tracking, optimize real-time GPU
pipelines, and adapt to diverse climates. Our goal is pushing the frontier of
meteorological + imaging synergy for robust long-range vision.
Reach us via the WACV 2025 paper authors or through GitHub (#).